

Ubuntu Rust代码如何调试与优化
在Ubuntu上调试Rust代码时可使用println!/dbg!宏、GDB/LLDB及增强版rust-gdb/rust-lldb等,或集成VSCode的rust-analyzer等工具。优化时,常采用release模式与LTO,避免不必要分配等,利用迭代器和Rayon等并行计算,采用Tokio处理异步I/O等,使用jemalloc分配器,并通过perf和火
Let’s talk about debugging Rust code on Ubuntu. Whether you’re hunting down a logic error or tracking a memory issue, the right setup makes all the difference. Here’s a practical walkthrough—from basic print statements to full IDE integration.

1. Preparation: Build with Debug Information
First things first: make sure your Rust program carries debug symbols. The default cargo build already includes them, but if you need finer control—say, to adjust the verbosity of debug logs—you can tune the debug profile inside Cargo.toml.
cargo build
# Debug build (includes debug info)
[profile.dev]
debug = true # Enabled by default2. Simple Debugging with Macros
println!/dbg!: For quick checks,println!("{:?}", variable)prints values, whiledbg!(variable)goes a step further—it shows the file, line number, and the value in one handy output. Example:fn main() { let x = 42; dbg!(x); // Output: [src/main.rs:2] x = 42 }
3. Using GDB/LLDB for Low-Level Debugging
- Install Tools: On Ubuntu, grab GDB or LLDB via:
sudo apt install gdb lldb - Debug with GDB:
- Compile:
cargo build. - Start GDB:
gdb target/debug/your_program. - Set breakpoints (
break main.rs:5), run (run), step through (next/step), inspect variables (print x).
- Compile:
- Debug with LLDB:
- Start LLDB:
lldb target/debug/your_program. - Use commands like
breakpoint set --name main,run,next, andframe variable.
- Start LLDB:
4. Rust-Enhanced Debuggers (rust-gdb/rust-lldb)
Rust ships clever wrappers around GDB and LLDB. They automatically load debug symbols and improve the display of Rust-specific types (enums, structs, etc.). Fire them up the same way:
rust-gdb target/debug/your_program    # Rust-aware GDB
rust-lldb target/debug/your_program   # Rust-aware LLDB
5. IDE Integration (Visual Studio Code)
If you prefer a graphical interface, VS Code with the rust-analyzer extension is a solid choice. Here’s how to set it up:
- Install
rust-analyzerfrom the VS Code marketplace. - Create a
launch.jsonin.vscode/with a debug configuration like this:{ "version": "0.2.0", "configurations": [ { "type": "lldb", "request": "launch", "name": "Debug", "program": "${workspaceFolder}/target/debug/your_program", "args": [], "cwd": "${workspaceFolder}" } ] } - Set breakpoints in your code, hit
F5, and use the debug sidebar to inspect variables, call stacks, and control execution.
6. Logging for Debugging
Structured logging with the log crate and env_logger gives you runtime control over verbosity. Add the dependencies to Cargo.toml:
[dependencies]
log = "0.4"
env_logger = "0.10"
Then initialize the logger in main.rs:
use log::{info, warn};
fn main() {
    env_logger::init(); // Initialize logger
    info!("Program started");
    warn!("This is a warning");
}
Control log levels at runtime via environment variables:
RUST_LOG=info cargo run # Show INFO and higher logsNow let's flip the coin and talk about optimizing Rust code on Ubuntu—because debugging is only half the story.
1. Compiler Optimizations
- Use
releaseMode: The--releaseflag turns on inlining, loop unrolling, and other goodies. For production builds, there’s no going around it:cargo build --release - Adjust Optimization Levels: You can fine-tune with
RUSTFLAGS. Enabling link-time optimization (LTO) often squeezes out extra performance:RUSTFLAGS="-C opt-level=3 -C lto" cargo build --release
2. Code-Level Optimizations
- A void Unnecessary Allocations: Pre-allocate collections like
Vec::with_capacity(100)to reduce dynamic resizing overhead. - Use Iterators: Iterators are zero-cost abstractions—often faster than manual loops. Summing a vector?
iter().sum()is both cleaner and more efficient.let sum: i32 = vec![1, 2, 3].iter().sum(); - Reduce Lock Contention: Keep the scope of
Mutexlocks minimal, and considertokio::sync::Mutexfor async code to a void bottlenecks.
3. Concurrency with Rayon and Tokio
- Parallelize Computations: With the
rayoncrate, parallelizing a sum is almost trivial:use rayon::prelude::*; let sum: i32 = vec![1, 2, 3].par_iter().sum(); - Async I/O with Tokio: For network servers or other I/O-bound tasks,
tokiohandles concurrent connections without breaking a sweat. Here’s a minimal echo server:use tokio::net::TcpListener; #[tokio::main] async fn main() -> Result<(), Box> { let listener = TcpListener::bind("127.0.0.1:8080").await?; loop { let (mut socket, _) = listener.accept().await?; tokio::spawn(async move { let mut buf = [0; 1024]; loop { let bytes_read = socket.read(&mut buf).await.unwrap(); if bytes_read == 0 { return; } socket.write_all(&buf[0..bytes_read]).await.unwrap(); } }); } }
4. Memory Management
- Use Efficient Allocators: Switch to
jemalloc(especially beneficial for multi-threaded programs) by setting:export RUSTFLAGS="-C target-cpu=native -C link-arg=-ljemalloc" cargo build --release - A void Memory Leaks: Tools like
valgrindhelp catch leaks early:valgrind --tool=memcheck --leak-check=full ./target/release/your_program
5. Performance Analysis
- Use
perf: Analyze CPU usage, cache misses, and hot functions:perf record ./target/release/your_program perf report - Visualize Bottlenecks with Flamegraphs: Generate flamegraphs to spot performance hotspots at a glance:
cargo install flamegraph
flamegraph ./target/release/your_program   # Produces flamegraph.svg
6. System Tuning
- Adjust File Descriptors: For servers handling many connections, bump the limit temporarily:
For a permanent change, editulimit -n 65536/etc/security/limits.conf. - Optimize TCP Parameters: Tweak kernel settings like
net.ipv4.tcp_max_syn_backlogto improve network throughput in high‑load scenarios.
That wraps up the essential toolkit for both debugging and optimizing Rust code on Ubuntu. The key is to start simple, then layer in more advanced tools as the complexity of your project grows. Happy coding!

针对Java开发者的实用大数据技术路线解析,深入梳理Hadoop生态存储与资源调度、Spark离线计算与内存模型、Flink低延迟流处理的核心技术要点及递进学习方法。

一份结构清晰、注重实操的Python爬取网页详细教程,涵盖环境搭建、HTTP请求发送、HTML解析、数据持久化存储与异常处理等完整步骤与代码实例。
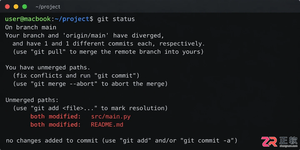
遇到Git合并冲突别慌张,本文详解冲突产生的原因及标准处理流程,涵盖查看冲突文件、理解标记含义、手动修改代码及完成合并提交的完整步骤,助你高效解决协作开发中的代码冲突问题。

深入对比Java中获取当前时间戳的两种主流方式:System.currentTimeMillis与java.time.Instant。分析二者的精度差异、API设计、时钟回拨影响与实际选型建议。

针对大数据工程场景,系统对比Java、Scala与Python在执行性能、生态结合、开发效率和维护成本上的核心差异,给出清晰的架构选型依据与落地方案。
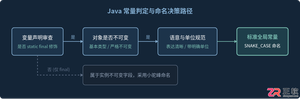
深入解析Java常量命名标准、大写下划线语义规则,剖析接口常量反模式的危害与本质原因,并提供枚举、不可实例化常量工具类等工业级最佳替代方案。
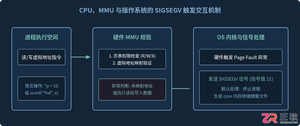
针对C语言常见的段错误(Segmentation fault)问题,详细剖析内存非法访问根因,提供结合GDB、Core Dump与AddressSanitizer的标准化排查解决步骤与预防方法。
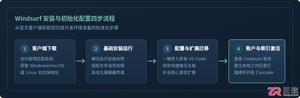
本文提供全面的Windsurf开发工具安装与使用详细教程,覆盖客户端下载安装、环境配置与VS Code插件迁移、Cascade核心协作中枢使用技巧、Chat与Write双模式实战及高效开发规范。
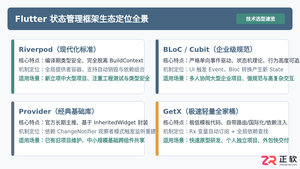
全面盘点Flutter主流状态管理框架,深度解析Provider、Riverpod、Bloc与GetX的核心机制、优缺点及适用场景,提供系统化的状态管理选型指南。
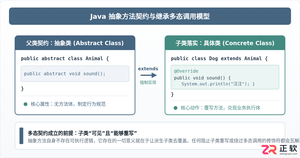
深入剖析Java中抽象方法为何严禁使用private和static修饰符。从面向对象契约规范、方法继承重写、JVM动态绑定(invokevirtual)与静态解析(invokestatic)等底层机制展开详细推导,结合编译报错示例与全景对比,彻底理清修饰符限制背后的设计逻辑。




IntelliJ IDEA 是 JetBrains 推出的专业集成开发环境,重点服务于 Java、Kotlin 与 JVM 项目开发。软件集成代码补全、静态检查、重构、调试、测试、版本控制及构建工具,并可借助插件扩展语言和框架支持。

JetBrains PyCharm 是面向 Python 开发者的集成开发环境,提供智能补全、代码检查、重构、调试、测试、版本控制及虚拟环境管理功能。Mac 版兼容 Intel 与 Apple 芯片,核心功能可免费使用。

JetBrains WebStorm 是面向 JavaScript、TypeScript 和现代 Web 技术的专业集成开发环境,可智能理解项目结构,提供代码补全、重构、错误检查、运行调试、测试及 Git 工具。

JetBrains IntelliJ IDEA 是以 Java、Kotlin 和 JVM 项目为核心的专业集成开发环境,提供智能补全、代码检查、安全重构、调试、测试、版本控制及构建工具集成。统一发行版的核心功能可免费用于商业和非商业项目,

PhpStorm 是 JetBrains 面向 PHP 与现代 Web 开发打造的专业集成开发环境,提供代码补全、静态检查、重构、调试、测试、数据库、版本控制及前端语言支持。Windows 用户可直接下载安装程序,

PyCharm 是 JetBrains 推出的 Python 集成开发环境,提供智能代码补全、错误检查、重构、调试、测试、Git、终端及 Jupyter Notebook 支持。统一版安装后可体验 30 天 Pro 功能,


