

Linux C++编程中如何调试程序
LinuxC++调试常用工具有GDB、LLDB、VSCode扩展及Valgrind。GDB功能全面,支持断点单步等;LLDB风格现代且运行快速,与Clang集成好;VSCode提供图形化调试界面,对新手友好;Valgrind主要检测内存泄漏和非法访问。多练习可显著提升调试效率,建议根据具体需求灵活选择。
在Linux环境下用C++写代码,调试这件事儿迟早要面对。不管你是刚入门还是写过几年,总会在某个深夜盯着段错误(Segmentation Fault)发呆——这时候,手头那几把调试利器就是你的救命稻草。下面把几个最常用的方法和工具梳理一下,希望能帮你少走弯路。
1. 用GDB(GNU Debugger)
GDB是Linux下历史最久、功能最全的调试器,没有之一。很多老派的C++开发者基本天天跟它打交道。它的学习曲线稍微陡了一点,但一旦上手,你会觉得“没有GDB这代码我都没法写”。
基本用法
- 启动GDB:
gdb your_program - 设置断点:
break main - 运行程序:
run - 单步执行:
step或next - 查看变量值:
print variable_name - 继续执行:
continue - 退出GDB:
quit
示例
gdb ./my_program
(gdb) break main
Breakpoint 1 at 0x401136: file my_program.cpp, line 10.
(gdb) run
Starting program: /path/to/my_program

Breakpoint 1, main () at my_program.cpp:10
10    int x = 5;
(gdb) next
11    int y = x + 3;
(gdb) print x
$1 = 5
(gdb) continue
Continuing.
2. 用LLDB
LLDB是LLVM项目里的调试器,近几年发展很快,尤其是在macOS上已经成为默认工具。但Linux下也能用,而且它的命令风格比GDB稍微现代一些。如果你习惯LLVM生态,LLDB是个很好的选择。
基本用法
- 启动LLDB:
lldb your_program - 设置断点:
breakpoint set --name main - 运行程序:
run - 单步执行:
step或next - 查看变量值:
frame variable - 继续执行:
continue - 退出LLDB:
quit
示例
lldb ./my_program
(lldb) breakpoint set --name main
Breakpoint 1: where = my_program`main + 10 at my_program.cpp:10, address = 0x0000000100001136
(lldb) run
Process 12345 launched: '/path/to/my_program' (x86_64)
Process 12345 stopped
* thread #1, queue = 'com.apple.main-thread', stop reason = breakpoint 1.1
    frame #0: 0x0000000100001136 my_program`main + 10
    7   int x = 5;
    8   int y = x + 3;
    9   return 0;
-> 10 }
(lldb) frame variable
x = 5
y = 8
(lldb) continue
Process 12345 resuming
3. 用Visual Studio Code (VS Code)
现在很多开发者更偏爱图形界面。VS Code配合C/C++扩展,可以无缝对接GDB或LLDB,调试体验跟IDE几乎一样。配置起来也不复杂,唯一需要你动手的就是写一份launch.json文件。
配置步骤
- 安装C/C++扩展(从扩展市场搜一下就行)。
- 在项目目录下创建
.vscode/launch.json文件,填入调试配置。
示例launch.json
{
    "version": "0.2.0",
    "configurations": [
        {
            "name": "Debug C++ Program",
            "type": "cppdbg",
            "request": "launch",
            "program": "${workspaceFolder}/your_program",
            "args": [],
            "stopAtEntry": false,
            "cwd": "${workspaceFolder}",
            "environment": [],
            "externalConsole": true,
            "MIMode": "gdb",
            "miDebuggerPath": "/usr/bin/gdb",
            "setupCommands": [
                {
                    "description": "Enable pretty-printing for gdb",
                    "text": "-enable-pretty-printing",
                    "ignoreFailures": true
                }
            ],
            "preLaunchTask": "build"
        }
    ]
}
4. 用Valgrind
调试段错误和逻辑错误是一回事,但内存泄漏、非法内存访问这种“慢性病”光靠断点是很难抓的。这时候就得请出Valgrind。它是个内存调试和分析工具,能帮你揪出那些程序跑完也看不出来的问题。说实话,很多线上崩溃的根因,都是靠Valgrind一层层扒出来的。
基本用法
- 运行程序(并开启完整内存泄漏检查):
valgrind --leak-check=full ./your_program
示例输出
valgrind --leak-check=full ./my_program
==12345== Memcheck, a memory error detector
==12345== Copyright (C) 2002-2017, and GNU GPL'd, by Julian Seward et al.
==12345== Using Valgrind-3.15.0 and LibVEX; rerun with -h for copyright info
==12345== Command: ./my_program
==12345==
==12345== HEAP SUMMARY:
==12345==     in use at exit: 0 bytes
==12345==     total heap usage: 1 allocs, 1 frees, 1,073,741,824 bytes allocated
==12345==
==12345== All heap blocks were freed -- no leaks are possible
==12345==
==12345== For lists of detected and suppressed errors, rerun with: -s
==12345== ERROR SUMMARY: 0 errors from 0 contexts (suppressed: 0 from 0)
上面这四把刀——GDB、LLDB、VS Code + 扩展、Valgrind——基本涵盖了Linux下C++调试的绝大多数场景。平时自己写练习项目可以先用GDB练练手;团队协作或者需要快速定位问题时,VS Code的图形化调试显然更高效。至于Valgrind,建议养成编译完就跑一遍的习惯,很多隐形的坑能提前填上。调试这事没什么捷径,多上手、多踩坑,自然就熟练了。
掌握Linux中删除用户和用户组的正确方法,避免残留文件和进程冲突。本文深入解析userdel和groupdel命令的参数用法,提供处理“用户仍在使用”等常见错误的实战方案。

遇到CrossOver运行错误或需要更新版本时,如何彻底卸载旧版并干净重装?本教程详解macOS和Linux下的卸载步骤、残留文件清理方法及官方下载渠道,确保软件环境纯净稳定。



AirBuddy 3 是面向 macOS 的蓝牙外设增强工具,可集中查看 AirPods、Beats 与苹果设备电量,提供快速连接、播放控制、电量提醒、桌面小组件和多台 Mac 外设接力等功能。

AirServer macOS版可把 Mac 转换为无线投屏接收端,通过 AirPlay 或 Google Cast 接收手机、平板和电脑画面,并支持多设备同时连接、高清镜像及会话录制,适合家庭娱乐、课堂教学、会议演示和应用展示。

AnyDesk macOS版是一款适用于远程办公、设备维护和客户支持的远程桌面工具,可连接并操作异地计算机,支持文件传输、无人值守访问、会话权限控制及跨平台协作。

StarUML 7 Windows版是一款面向软件工程、系统分析与架构设计的专业建模工具,支持UML 2、ERD、流程图、数据流图和C4模型等,可用于需求梳理、系统设计、模型验证、文档发布及代码生成。
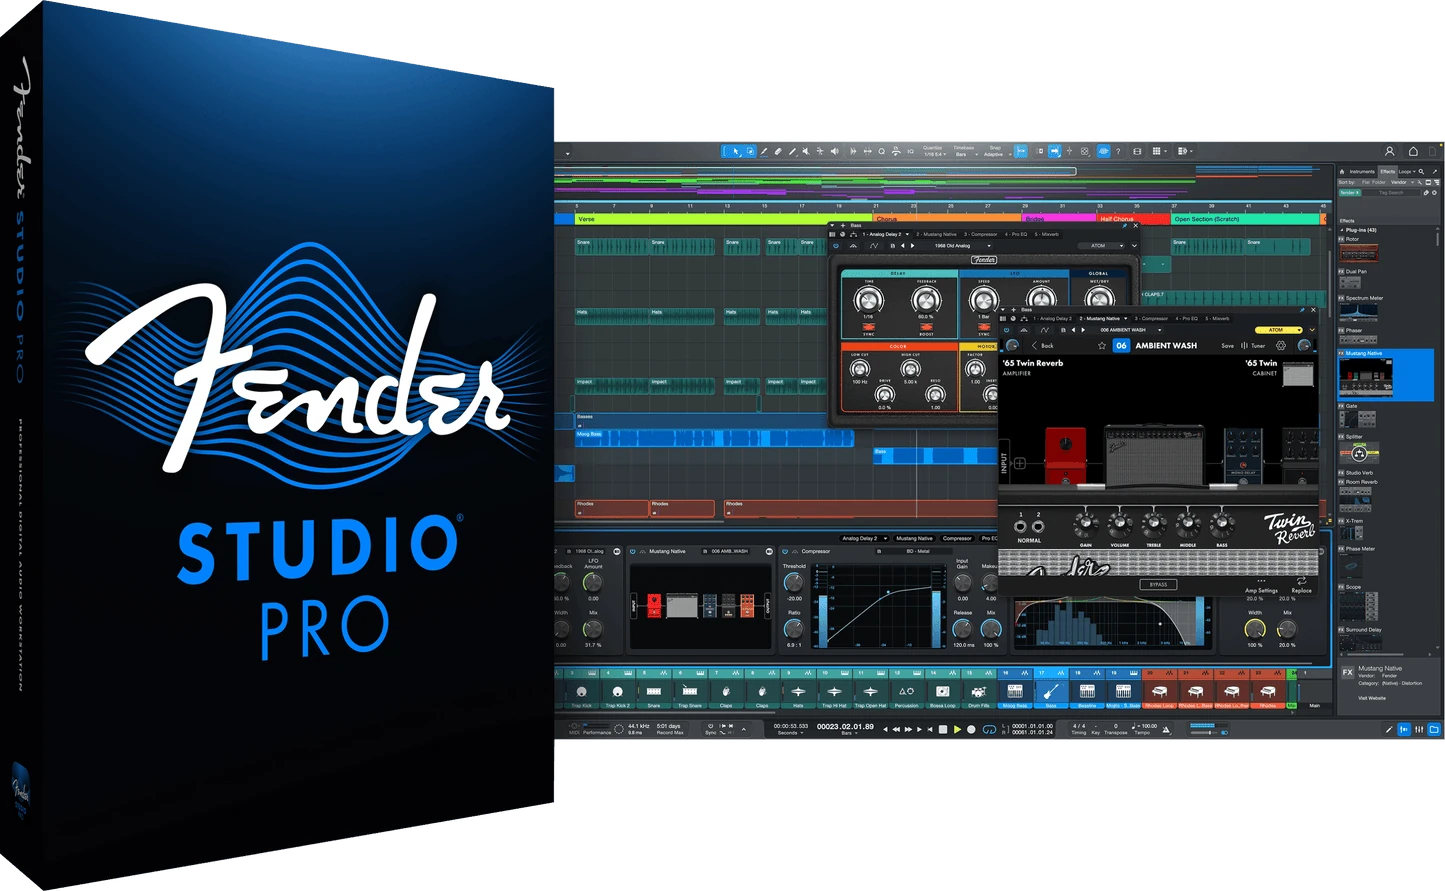
Fender Studio Pro(原Studio One)Windows版是一套专业数字音频工作站,可完成录音、编曲、混音、母带处理与现场演出。 新版本延续Studio One的核心工作流,并加入Fender音箱与效果建模、智能创作和更现代的制作界面。

think-cell Windows版是一款集成于Microsoft PowerPoint和Excel的商业演示增强插件,提供瀑布图、甘特图、Mekko图、数据联动、自动标注及智能排版功能,适合咨询、金融、项目管理和企业汇报场景。


