

filebeat在ubuntu上如何集成其他工具
Filebeat在Ubuntu上集成其他工具的常见方法 Filebeat作为轻量级日志采集器,在Ubuntu环境中往往需要与其他工具搭档才能发挥最大价值。下面梳理几种最常见的集成方式,从经典组合到灵活方案,逐个拆解配置要点。 1. 集成Logstash(日志处理与转发) Logstash是Elast
Filebeat在Ubuntu上集成其他工具的常见方法
Filebeat作为轻量级日志采集器,在Ubuntu环境中往往需要与其他工具搭档才能发挥最大价值。下面梳理几种最常见的集成方式,从经典组合到灵活方案,逐个拆解配置要点。
1. 集成Logstash(日志处理与转发)
Logstash是Elastic Stack中负责数据处理的“中间人”,Filebeat采集到的日志可以由它进行过滤、解析,再送往Elasticsearch或其他目标。具体怎么配置?
- 配置Filebeat:编辑
/etc/filebeat/filebeat.yml,在filebeat.inputs中指定日志路径(比如/var/log/*.log),然后在output.logstash中填入Logstash服务器地址,默认监听5044端口:
filebeat.inputs:
- type: log
  enabled: true
  paths:
    - /var/log/*.log
output.logstash:
  hosts: ["localhost:5044"]
# 若Logstash在远程服务器,替换为对应IP- 配置Logstash:创建一个配置文件(如
/etc/logstash/conf.d/filebeat.conf),定义输入(Beats插件)、过滤(比如用Grok解析Apache日志)和输出:
input {
  beats {
    port => 5044
  }
}
filter {
  grok {
    match => { "message" => "%{COMBINEDAPACHELOG}" }
  }
  # 示例:解析Apache日志
}
output {
  elasticsearch {
    hosts => ["localhost:9200"]
    index => "filebeat-%{+YYYY.MM.dd}"
  }
}- 启动服务:分别启动Filebeat和Logstash,并设为开机自启:
sudo systemctl start filebeat && sudo systemctl enable filebeat
sudo systemctl start logstash && sudo systemctl enable logstash- 验证:查看Logstash日志(
/var/log/logstash/logstash-plain.log)确认数据是否接收,或者在Kibana中检查Elasticsearch的索引。
2. 集成Elasticsearch(直接存储日志)
如果不需要复杂的处理链路,Filebeat可以直接把日志扔给Elasticsearch,架构更简洁。配置步骤:
- 配置Filebeat:编辑
/etc/filebeat/filebeat.yml,在output.elasticsearch中指定地址和索引名称:
filebeat.inputs:
- type: log
  enabled: true
  paths:
    - /var/log/*.log
output.elasticsearch:
  hosts: ["localhost:9200"]
  index: "filebeat-%{[agent.version]}-%{+yyyy.MM.dd}"
# 动态生成索引名- 启动服务:启动Filebeat并设置开机自启:
sudo systemctl start filebeat && sudo systemctl enable filebeat- 验证:通过Elasticsearch的
_cat/indices接口查看索引是否创建:
curl -X GET "localhost:9200/_cat/indices?v&pretty"若看到filebeat-*索引,说明集成成功。
3. 集成Kafka(消息队列缓冲)
当Elasticsearch集群负载较高时,Kafka可以作为缓冲层,解决Filebeat与Elasticsearch之间的性能瓶颈。配置步骤:
- 安装Kafka:下载并启动Kafka(需提前安装ZooKeeper):
wget https://downloads.apache.org/kafka/3.6.1/kafka_2.13-3.6.1.tgz
tar -xzf kafka_2.13-3.6.1.tgz
cd kafka_2.13-3.6.1
# 启动ZooKeeper(后台模式)
bin/zookeeper-server-start.sh config/zookeeper.properties &
# 启动Kafka(后台模式)
bin/kafka-server-start.sh config/server.properties &- 配置Kafka Topic:创建用于接收Filebeat日志的Topic(如
filebeat_logs):
bin/kafka-topics.sh --create --topic filebeat_logs --bootstrap-server localhost:9092 --partitions 3 --replication-factor 1- 配置Filebeat:编辑
/etc/filebeat/filebeat.yml,将输出改为Kafka:
filebeat.inputs:
- type: log
  enabled: true
  paths:
    - /var/log/*.log
output.kafka:
  hosts: ["localhost:9092"]
  topic: "filebeat_logs"
  required_acks: 1
  # 确认机制
  compression: gzip
# 压缩减少带宽占用- 启动服务:启动Filebeat并验证Kafka是否接收到数据:
sudo systemctl start filebeat
# 查看Kafka Topic中的消息
bin/kafka-console-consumer.sh --topic filebeat_logs --from-beginning --bootstrap-server localhost:9092
若能看到Filebeat发送的日志,说明集成成功。
4. 集成自定义HTTP服务(灵活对接)
如果想把日志发到自定义的HTTP API(比如第三方监控平台),Filebeat的http输出模块就能派上用场。配置步骤:
- 配置Filebeat:编辑
/etc/filebeat/filebeat.yml,在output.http中指定目标服务的地址、端口和端点:
filebeat.inputs:
- type: log
  enabled: true
  paths:
    - /var/log/*.log
output.http:
  hosts: ["your-custom-service:8080"]
  # 自定义服务的IP和端口
  endpoint: "/logs"
  # 接收日志的API端点
  ssl.verification_mode: none
  # 若未启用HTTPS,关闭证书验证
  headers:
    Content-Type: "application/json"
# 指定请求头- 启动服务:启动Filebeat,然后检查自定义服务的日志,确认是否接收到数据。
5. 结合tcpdump监控网络流量(补充场景)
如果需要监控网络流量并将数据送入Filebeat,可以使用tcpdump抓取流量并保存为文件,再由Filebeat采集。配置步骤:
- 安装tcpdump:
sudo apt-get update && sudo apt-get install tcpdump- 抓取流量并保存:抓取HTTP流量(端口80),保存到
/var/log/http_traffic.log:
sudo tcpdump -i any -s 0 -w /var/log/http_traffic.log 'tcp port 80'- 配置Filebeat:编辑
/etc/filebeat/filebeat.yml,添加log输入来读取tcpdump生成的文件:
filebeat.inputs:
- type: log
  enabled: true
  paths:
    - /var/log/http_traffic.log
  json.keys_under_root: true
  # 若日志为JSON格式,平铺字段
  json.add_error_key: true
  # 添加错误字段
output.elasticsearch:
  hosts: ["localhost:9200"]
index: "http_traffic-%{+yyyy.MM.dd}"- 启动服务:启动Filebeat,然后验证Elasticsearch中是否有
http_traffic-*索引。
以上几种方案覆盖了Filebeat在Ubuntu上与常见工具的集成场景,可以根据实际需求灵活选择。集成过程中,网络安全(如启用SSL/TLS)、权限配置(Filebeat对日志文件的读取权限)以及服务状态监控(通过systemctl status检查)都是需要注意的细节。
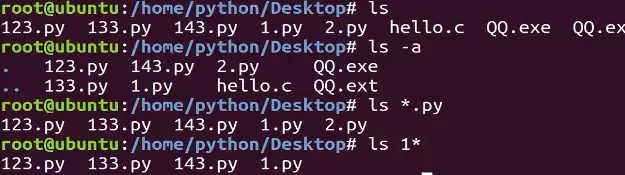
本教程指导Ubuntu新手打开终端,通过pwd、ls、cd、mkdir和touch命令完成基础文件目录操作。适用于桌面版、虚拟机及WSL环境,提供从查看路径到创建测试文件的完整验证步骤,帮助读者建立命令行操作的安全意识与正确习惯。
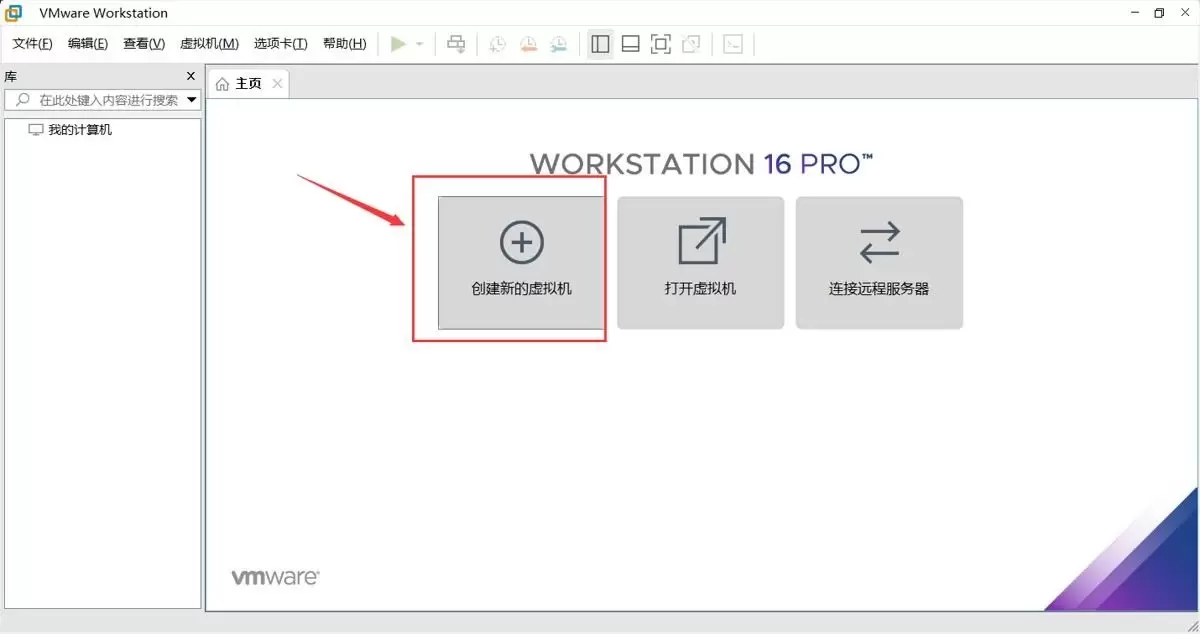
本文提供在VMware中安装Ubuntu并验证启动的完整流程。适用于首次练习Linux或搭建开发环境的用户。按步骤完成虚拟机创建、ISO挂载、硬件分配与安装后,可通过终端命令确认版本、内核与网络状态,确保系统可正常使用。
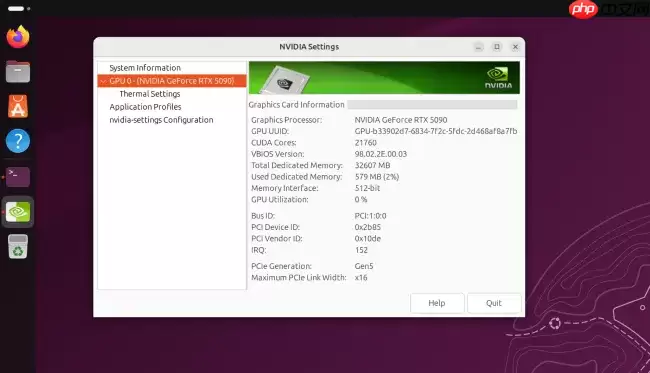
Ubuntu26.04LTS针对英伟达显卡在Wayland+GNOME环境进行性能调优,通过修改gbm_surface_lock_front_buffer函数,将帧渲染等待时间从毫秒级降至微秒级,显著提升UI响应和画面流畅度。该补丁已作为发行版专属补丁集成,确保LTS用户无需等待上游整合即可获得优化体验。

UbuntuTouch24.04-2.0Beta发布,底层升级至Ubuntu24.04,浏览器引擎从Chromium87跃升至134,网页兼容性显著提升;新增屏幕刘海区域自动适配、截图编辑器、网络指示器改进、移动数据可靠性增强、数据加密稳定,并新增NothingPhone(1)等设备支持。

ufw status仅显示高层策略和显式添加的规则(如“80 ALLOW Anywhere”),不反映默认策略绕过、IPv6独立规则、Docker等直写nftables的bypass规则,也无法体现本地回环流量不受管控等底层细节。Ubuntu 默认用 ufw 管理防火墙,但规则实际由 nftable

锁屏背景和桌面壁纸之所以不同,是因为GNOME默认会复制桌面壁纸,然后强制叠加高斯模糊和亮度调整效果,这个效果是由lockDialogGroup的CSS来控制的。要是想去除模糊,建议使用Control Blur Effect On Lock Screen扩展,把Adjust Sigma设置为0就行。

Ubuntu Swapper(一般就是指Ubuntu的交换分区或者交换文件)在服务器上的应用成效,是由多个因素共同决定的,像服务器的硬件配置情况、工作负载的类型以及交换空间的大小和具体配置等。下面为大家带来一些有关Ubuntu Swapper在服务器上应用效果的一般性评价:正面效果内存管理:交换空间

根本原因是纯命令行tty默认不支持UTF-8及中文字体渲染,locale设置仅影响字符解析逻辑,不解决字体绘制问题;图形终端自带UTF-8渲染,而tty需借助fbterm等工具实现中文显示。为什么终端里中文显示为问号或方块 纯命令行(tty,例如通过Ctrl+Alt+F3进入的界面)默认不会加载UT

通过分析Tomcat日志来提升Ubuntu服务器性能是一个很好的方法。以下是一些步骤和建议,帮助你通过Tomcat日志来优化服务器性能:1. 收集日志首先,得保证你的Tomcat服务器有详细的日志记录配置。在conf/logging.properties文件里,你可以对日志级别和输出格式进行调整。o

直接修改PS1是最为可控且轻量的方法。因为GNOME Terminal主题难以区分提示符、命令输入与输出,而PS1搭配ANSI转义码能够精准地为各个字段上色,并且需要用[ ]进行包裹,以防止光标出现错位的情况。直接改 PS1 是最可控、最轻量的方式,不需要装框架或改终端全局配色。 为什么不用改 GN




Postman是一套面向API全生命周期的开发与测试平台,可在Mac上发送和调试多种协议请求,管理集合、环境及认证信息,并完成脚本测试、模拟服务、监控、文档发布和团队协作。它适合开发、测试及运维人员使用,提供个人免费方案。
Docker Desktop 是 Docker 官方为 Mac 提供的容器开发环境,集成 Docker Engine、命令行工具、Compose、Build、Kubernetes 与图形化管理界面。

Android Studio 是 Google 面向安卓应用开发提供的官方集成开发环境,基于 IntelliJ IDEA 构建。它整合智能代码编辑、Gradle 构建、界面预览、设备模拟、性能分析、调试测试及 APK 分析等工具。

PixPix 是面向品牌、卖家和内容团队的在线 AI 图片视频创作平台,提供图视频 Agent、无限画布、图片生成、视频生成、自然语言编辑及商品套图、产品精修和带货视频等电商工具。

Postman 是面向 API 全生命周期的开发与协作平台。Windows 桌面版可用于构建和发送 HTTP、GraphQL、gRPC、WebSocket、MQTT 等请求,并提供环境变量、集合、脚本测试、模拟服务、监控、文档及团队工作区等

Docker Desktop 为 Windows 开发者提供集成式容器环境,内置 Docker Engine、命令行工具、Compose、Build 与 Kubernetes 等组件,可在本机完成镜像构建、容器运行、日志查看和资源管理。