

centos上thinkphp如何进行性能监控
在CentOS上部署ThinkPHP时,可通过三种方式实现性能监控:启用内置调试工具与中间件记录请求耗时;引入Prometheus和Grafana进行可视化监控与告警;配置日志级别并利用grep、awk等工具分析日志,覆盖开发调试、生产监控与事后复盘场景。

1. 使用内置的性能分析工具
ThinkPHP自带了一套轻量级的性能分析能力,对快速定位性能瓶颈非常实用。启用性能分析
操作很简单:在application/config.php 中把调试模式打开,并根据需要开启对应的调试开关。配置项如下:
return [
    // ...
    'app_debug' => true, // 开启调试模式
    'app_debug_show_param' => true, // 显示请求参数
    'app_debug_show_sql' => true, // 显示SQL语句
    'app_debug_show_exception_trace' => true, // 显示异常堆栈
    'app_debug_show_request_trace' => true, // 显示请求跟踪
    // ...
];
使用性能分析中间件
除了配置开关,还可以通过中间件更精细地记录每次请求的耗时。在application/middleware 下新建一个中间件类,例如 PerformanceAnalysis.php:
namespace app\middleware;

use think\Request;
use think\Response;
use think\facade\Cache;

class PerformanceAnalysis
{
    public function handle(Request $request, Closure $next)
    {
        $start = microtime(true);
        $response = $next($request);
        $end = microtime(true);
        $time = ($end - $start) * 1000; // 转换为毫秒

        // 记录性能数据
        Cache::set('performance', [
            'url' => $request->url(),
            'method' => $request->method(),
            'time' => $time,
        ], 60); // 缓存60秒

        return $response;
    }
}
application/config.php 中注册这个中间件:
return [
    // ...
    'middleware' => [
        \app\middleware\PerformanceAnalysis::class,
    ],
    // ...
];
2. 使用第三方性能监控工具
如果生产环境需要长期、可视化的监控,内置工具就显得力不从心了。这时引入Prometheus和Grafana是业界的常见做法——一个负责采集和存储时序数据,一个负责展示和告警。Prometheus + Grafana
步骤如下: 1. **下载并解压Prometheus**wget https://github.com/prometheus/prometheus/releases/download/v2.30.3/prometheus-2.30.3.linux-amd64.tar.gz
tar xvfz prometheus-2.30.3.linux-amd64.tar.gz
cd prometheus-2.30.3.linux-amd64prometheus.yml,添加ThinkPHP应用的监控目标。
scrape_configs:
     - job_name: 'thinkphp'
       static_configs:
- targets: ['localhost:9090']./prometheus --config.file=prometheus.ymlwget https://dl.grafana.com/oss/release/grafana-8.2.0.linux-amd64.tar.gz
tar xvfz grafana-8.2.0.linux-amd64.tar.gz
cd grafana-8.2.0./bin/grafana-serverhttp://localhost:3000,默认用户名和密码均为 admin。登录后添加Prometheus数据源,然后创建仪表盘,即可将请求耗时、QPS等指标可视化展示出来。
这套组合拳能提供历史趋势、告警规则等高级能力,适合需要全天候监控的线上系统。
3. 使用日志分析
很多时候,性能问题并不需要实时告警,而是需要事后复盘。ThinkPHP的日志系统如果配置得当,完全可以承担这个角色。配置日志
在application/config.php 中,将日志级别设为 debug,并指定日志文件路径:
return [
    // ...
    'log' => [
        'level' => 'debug', // 设置日志级别为debug
        'file' => runtime_path() . 'logs/app.log', // 日志文件路径
    ],
    // ...
];
分析日志
通过系统自带的grep 和 awk 等工具,可以快速提取出关键信息。例如,提取所有包含“start”标记的日志行,并输出时间戳等字段:
grep 'start' runtime/logs/app.log | awk '{print $1, $2, $3, $4, $5, $6, $7, $8, $9, $10, $11, $12, $13, $14, $15, $16, $17, $18, $19, $20, $21, $22, $23, $24, $25, $26, $27, $28, $29, $30, $31, $32, $33, $34, $35, $36, $37, $38, $39, $40, $41, $42, $43, $44, $45, $46, $47, $48, $49, $50, $51, $52, $53, $54, $55, $56, $57, $58, $59, $60, $61, $62, $63, $64, $65, $66, $67, $68, $69, $70, $71, $72, $73, $74, $75, $76, $77, $78, $79, $80, $81, $82, $83, $84, $85, $86, $87, $88, $89, $90, $91, $92, $93, $94, $95, $96, $97, $98, $99, $100, $101, $102, $103, $104, $105, $106, $107, $108, $109, $110, $111, $112, $113, $114, $115, $116, $117, $118, $119, $120, $121, $122, $123, $124, $125, $126, $127, $128, $129, $130, $131, $132, $133, $134, $135, $136, $137, $138, $139, $140, $141, $142, $143, $144, $145, $146, $147, $148, $149, $150, $151, $152, $153, $154, $155, $156, $157, $158, $159, $160, $161, $162, $163, $164, $165, $166, $167, $168, $169, $170, $171, $172, $173, $174, $175, $176, $177, $178, $179, $180, $181, $182, $183, $184, $185, $186, $187, $188, $189, $190, $191, $192, $193, $194, $195, $196, $197, $198, $199, $200, $201, $202, $203, $204, $205, $206, $207, $208, $209, $210, $211, $212, $213, $214, $215, $216, $217, $218, $219, $220, $221, $222, $223, $224, $225, $226, $227, $228, $229, $230, $231, $232, $233, $234, $235, $236, $237, $238, $239, $240, $241, $242, $243, $244, $245, $246, $247, $248, $249, $250, $251, $252, $253, $254, $255, $256, $257, $258, $259, $260, $261, $262, $263, $264, $265, $266, $267, $268, $269, $270, $271, $272, $273, $274, $275, $276, $277, $278, $279, $280, $281, $282, $283, $284, $285, $286, $287, $288, $289, $290, $291, $292, $293, $294, $295, $296, $297, $298, $299, $300, $301, $302, $303, $304, $305, $306, $307, $308, $309, $310, $311, $312, $313, $314, $315, $316, $317, $318, $319, $320, $321, $322, $323, $324, $325, $326, $327, $328, $329, $330, $331, $332, $333, $334, $335, $336, $337, $338, $339, $340, $341, $342, $343, $344, $345, $346, $347, $348, $349, $350, $351, $352, $353, $354, $355, $356, $357, $358, $359, $360, $361, $362, $363, $364, $365, $366, $367, $368, $369, $370, $371, $372, $373, $374, $375, $376, $377, $378, $379, $380, $381, $382, $383, $384, $385, $386, $387, $388, $389, $390, $391, $392, $393, $394, $395, $396, $397, $398, $399, $400, $401, $402, $403, $404, $405, $406, $407, $408, $409, $410, $411, $412, $413, $414, $415, $416, $417, $418, $419, $420, $421, $422, $423, $424, $425, $426, $427, $428, $429, $430, $431, $432, $433, $434, $435, $436, $437, $438, $439, $440, $441, $442, $443, $444, $445, $446, $447, $448, $449, $450, $451, $452, $453, $454, $455, $456, $457, $458, $459, $460, $461, $462, $463, $464, $465, $466, $467, $468, $469, $470, $471, $472, $473, $474, $475, $476, $477, $478, $479, $480, $481, $482, $483, $484, $485, $486, $487, $488}'awk 的正则匹配或专门的日志分析工具(如ELK)来做更高效的处理,但用命令快速查看也是很多运维人员的习惯动作。
以上三种方法覆盖了开发调试、生产监控、事后复盘三大场景,可以根据实际需求灵活选用。关键不在于工具多炫酷,而在于能否持续跟踪、及时发现问题。 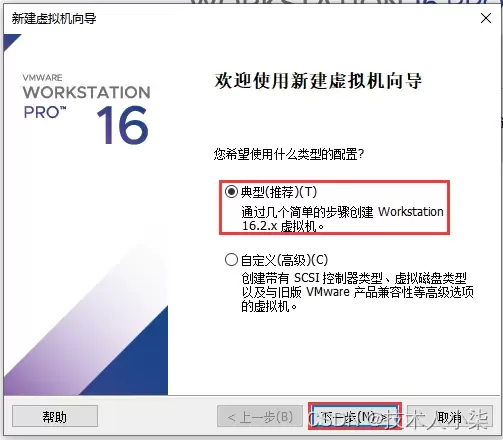
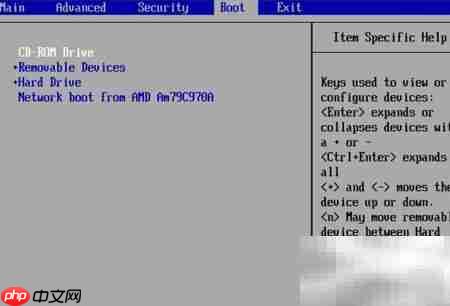
本文详细讲解如何在VMware Workstation中从零开始安装CentOS 7虚拟机。内容涵盖ISO镜像准备、典型配置创建、硬件参数分配(磁盘与内存)、安装器操作及首次启动后的版本与网络验证。通过规范化的步骤指引,帮助读者快速搭建稳定可用的Linux学习环境,并解决常见的启动与网络故障。
在CentOS系统上管理Python依赖库需先更新系统并安装Python3、pip及开发工具。安装方式包括pip(推荐)、yum/dnf(系统级)和conda。通过虚拟环境隔离依赖、用requirements.txt记录版本可避免冲突。卸载通过pip或yum/dnf完成。常见问题涉及权限、缺失系统依赖及版本兼容性。

在CentOS编译Java乱码时,需检查系统编码设为UTF-8,编译用-encodingUTF-8,运行设-Dfile.encoding=UTF-8,确保源文件编码一致,调整IDE编码,中文显示异常则安装中文字体。

通过升级JDK版本、启用增量编译与并行编译、优化JVM参数、利用构建工具高级特性、改进代码结构、进行系统级调优及持续监控分析,可显著提升CentOS环境下Java编译性能,减少重复编译,优化内存使用,从而缩短构建时间,提高开发效率。

在CentOS上编译Java程序时,需安装JDK并正确设置JAVA_HOME环境变量,通过命令查找安装路径并配置到~/.bashrc或/etc/profile中。同时关注编译器错误消息,修复代码语法或逻辑错误,确保Maven或Gradle等构建工具正确安装配置。

在CentOS上编译Golang程序,常见问题包括环境变量配置错误、依赖包管理混乱、glibc版本不兼容、编译器工具链缺失、代码或缓存异常、Go版本不匹配及权限不足,可通过逐一排查对应方法解决。

在CentOS上编译Golang:先安装开发工具包、wget和git;下载Go源码压缩包并解压至/usr/local;配置GOROOT和PATH环境变量(如添加至~/.bashrc),执行source生效;运行goversion验证安装成功。

在CentOS上提升Golang编译速度,可通过优化编译选项(如并行编译、去除调试信息)、将缓存目录指向SSD并定期清理,拆分代码为小包、消除循环依赖、使用vendor本地依赖,升级多核CPU、16GB以上内存和SSD,以及设置GOPROXY、采用PGO优化、升级Go版本等方式实现。
在CentOS编译Go程序时,需正确配置GOROOT、GOPATH等环境变量,使用GoModules管理依赖,注意Glibc版本兼容性,根据需求设置CGO_ENABLED=0实现静态链接,合理配置交叉编译参数,优化二进制文件大小,解决权限问题,并确保Go版本与项目要求一致。




Postman是一套面向API全生命周期的开发与测试平台,可在Mac上发送和调试多种协议请求,管理集合、环境及认证信息,并完成脚本测试、模拟服务、监控、文档发布和团队协作。它适合开发、测试及运维人员使用,提供个人免费方案。

Docker Desktop 是 Docker 官方为 Mac 提供的容器开发环境,集成 Docker Engine、命令行工具、Compose、Build、Kubernetes 与图形化管理界面。

Android Studio 是 Google 面向安卓应用开发提供的官方集成开发环境,基于 IntelliJ IDEA 构建。它整合智能代码编辑、Gradle 构建、界面预览、设备模拟、性能分析、调试测试及 APK 分析等工具。

PixPix 是面向品牌、卖家和内容团队的在线 AI 图片视频创作平台,提供图视频 Agent、无限画布、图片生成、视频生成、自然语言编辑及商品套图、产品精修和带货视频等电商工具。

Postman 是面向 API 全生命周期的开发与协作平台。Windows 桌面版可用于构建和发送 HTTP、GraphQL、gRPC、WebSocket、MQTT 等请求,并提供环境变量、集合、脚本测试、模拟服务、监控、文档及团队工作区等

Docker Desktop 为 Windows 开发者提供集成式容器环境,内置 Docker Engine、命令行工具、Compose、Build 与 Kubernetes 等组件,可在本机完成镜像构建、容器运行、日志查看和资源管理。